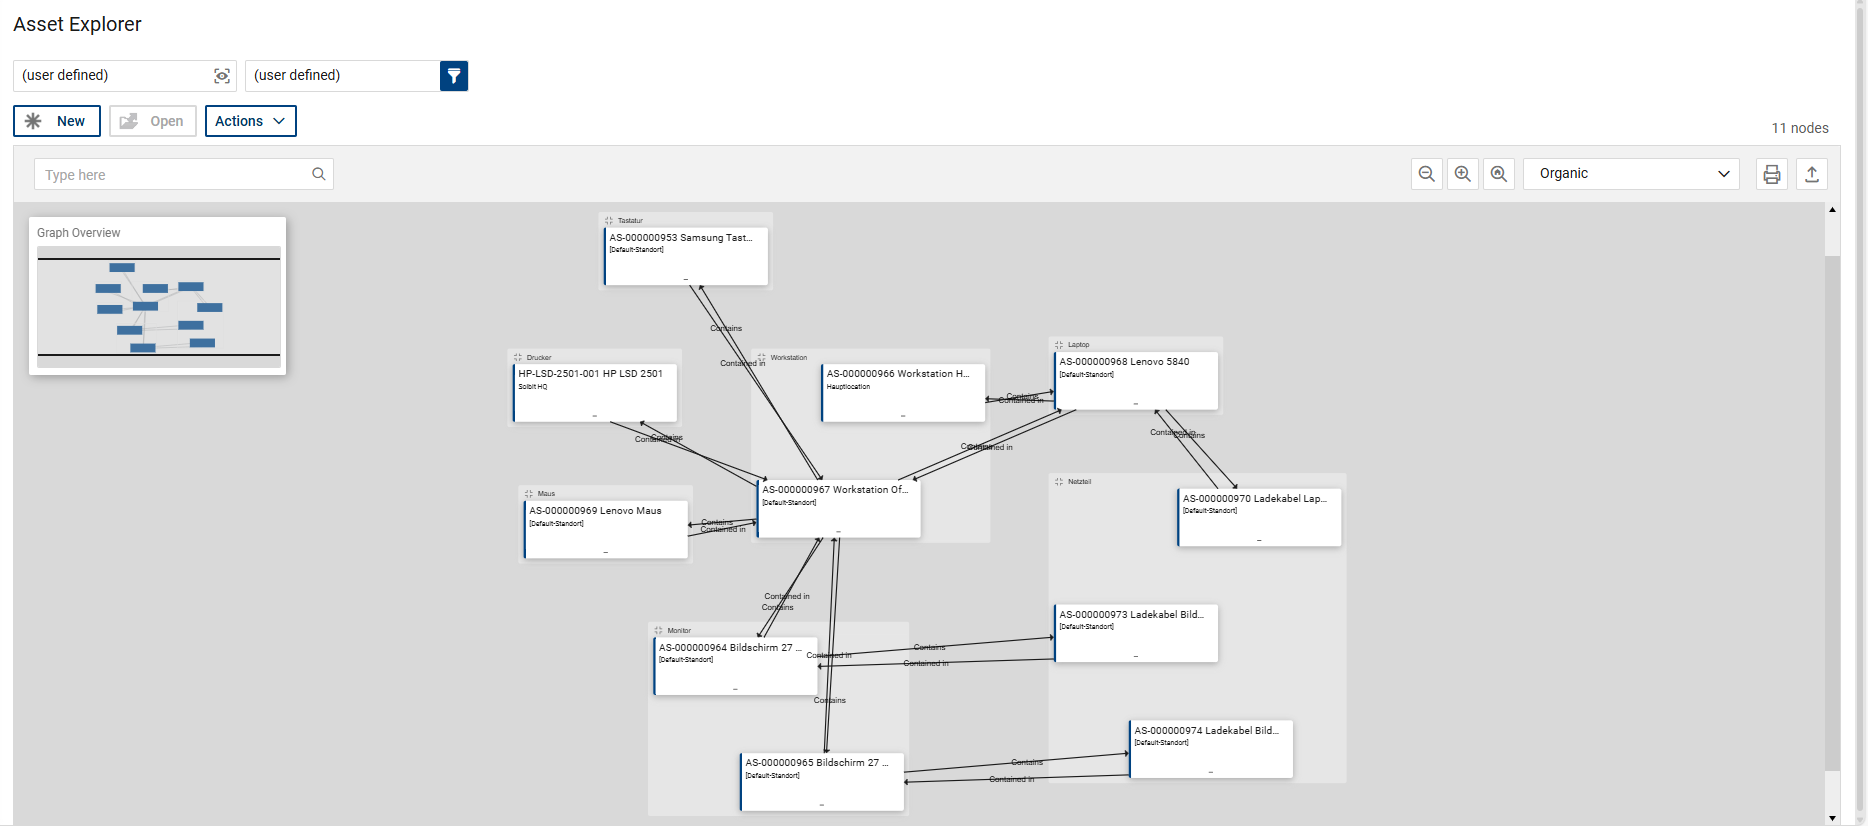
The ticketing system supports graphical visualisation of dependencies (Asset Explorer) between IT infrastructure components (known as ‘configuration items’ or CIs), assets and services, and their status. Visualisation can also be started from other areas (e.g. directly in an asset/CI in the asset database).
The Asset Explorer is used to graphically display relationships and dependencies between assets and their attributes. It helps users to clearly analyse complex relationships and quickly capture relevant information.
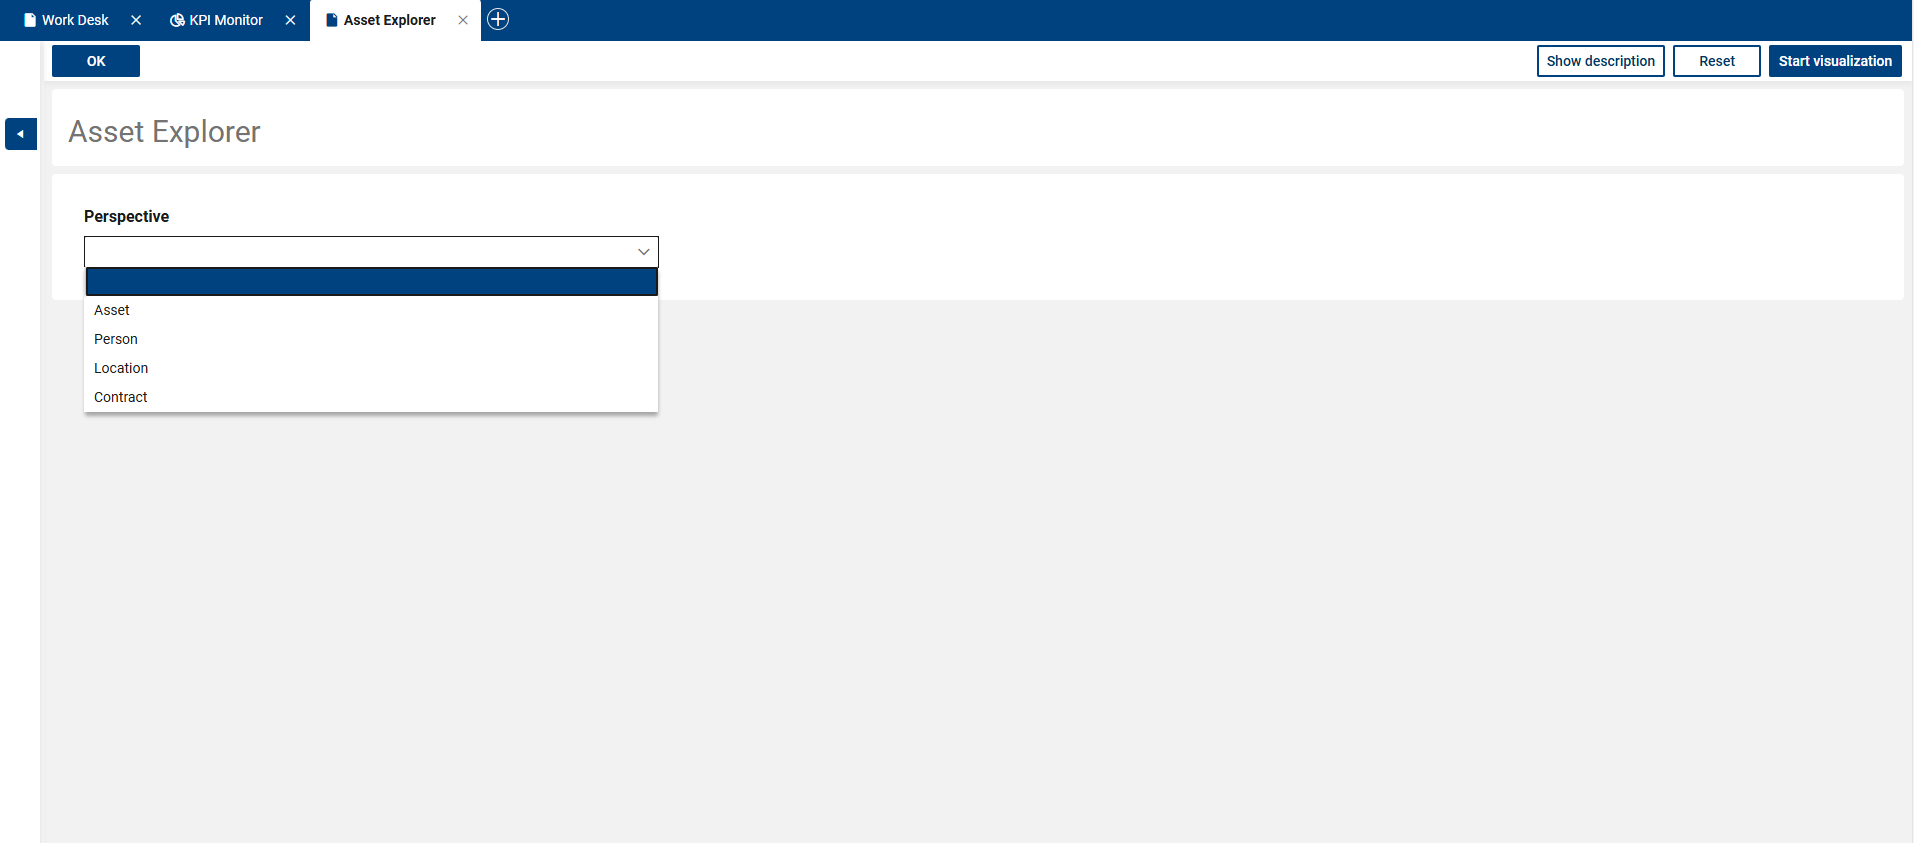
When you start using it, you select a starting point for the visualisation (perspective). The available perspectives are people, contracts, locations or individual assets. Based on this selection, the associated assets and their relationships are determined and displayed. The display can be restricted using filters to show or hide specific asset types. This increases the clarity of the visualisation.
|
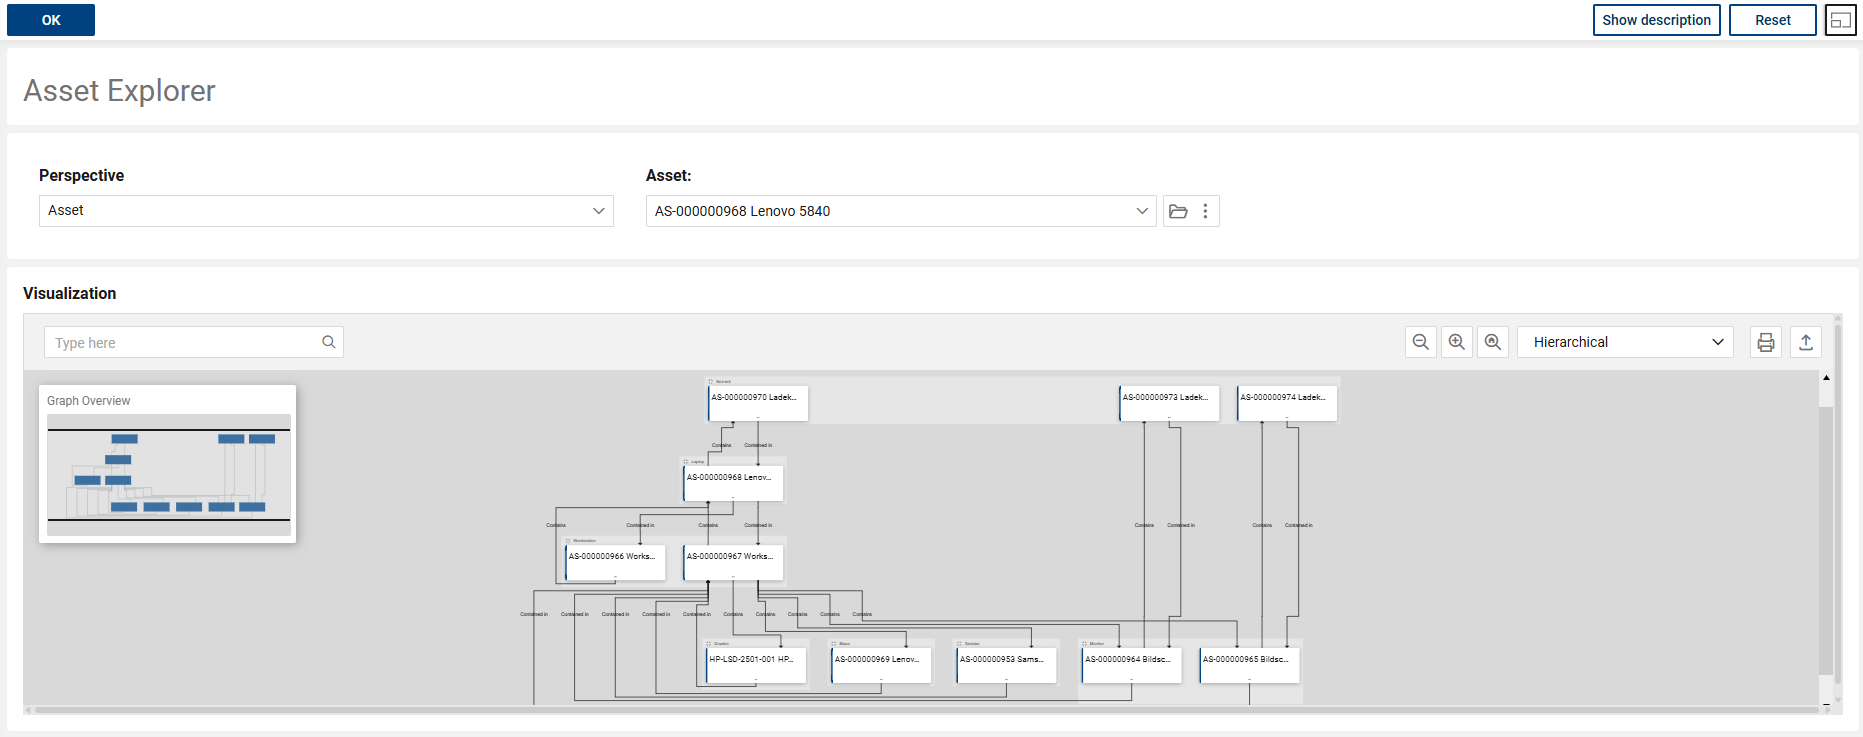
Note on the ‘Asset’ perspective: The Asset perspective displays all assets that contain the selected asset or are contained in the selected asset. The visualisation initially includes all available levels. These can be manually shown or hidden within the display in order to depict the desired hierarchy. The assets shown are grouped according to their types. Filtering by asset type is not possible in this perspective. |
|
Note on the ‘Person’ perspective: The Person perspective displays all assets directly assigned to the selected person and their associated locations. The assets are grouped according to their types, and the locations according to the respective top organisational unit to which they belong. |
|
Note on the ‘Location’ perspective: The Location perspective displays all assets directly assigned to the selected location and the persons associated with them. The assets are grouped according to their types, and the persons according to their respective organisational units. |
|
Note on the ‘Contract’ perspective: The Contract perspective displays all assets directly assigned to the selected contract and their associated locations. The assets are grouped according to their types, and the locations according to the respective top organisational unit to which they belong. Filtering by asset type is not possible in this perspective, as only assets of the Business Service type can be assigned to contracts. |
After selecting the perspective, it must also be filled with a corresponding start object (asset / person / location / contract).

The ‘Start visualisation’ function displays the identified assets graphically. Depending on the number of assets to be displayed and the size of the underlying asset database, it may take some time for the visualisation to load.

Various navigation options are available within the display: the view can be enlarged or reduced using the mouse wheel, and the visible area can be moved by clicking and dragging with the mouse.
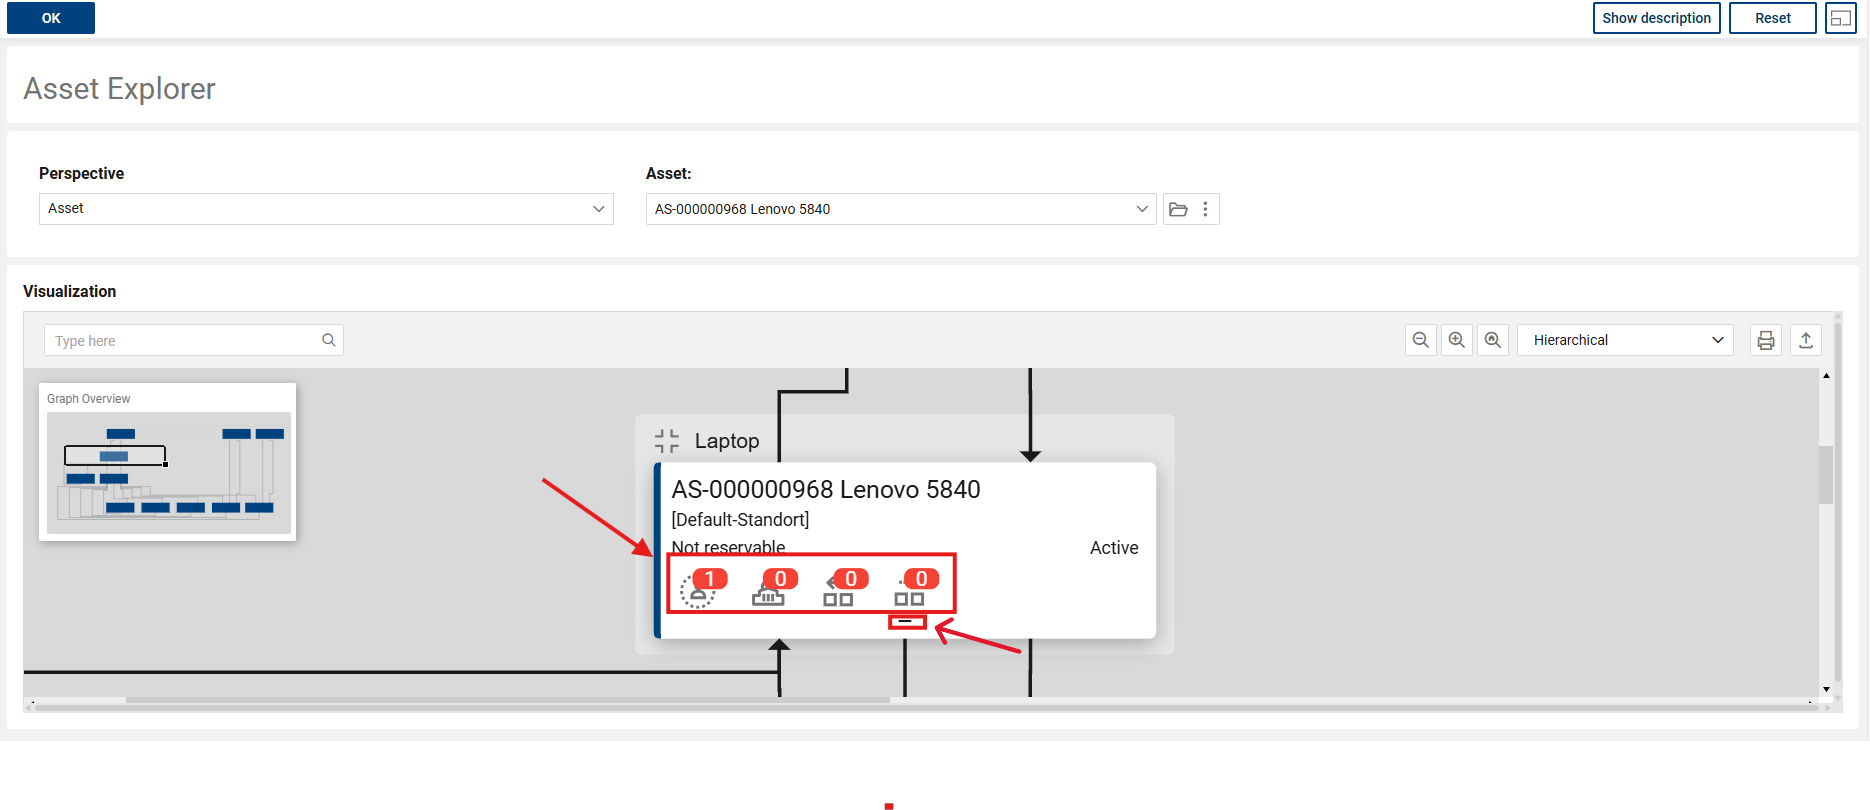
Individual objects displayed in the visualisation can be opened by double-clicking on them. Relationships between objects can be shown or hidden using the plus and minus symbols at the bottom of the object cards in order to further focus the display.
In addition, the object cards contain so-called decorators, which display further associated information at a glance, including associated persons, associated organisational units, and predecessor and successor relationships.
The ‘Reset’ function can be used to remove all settings and restore the Asset Explorer to its default state.
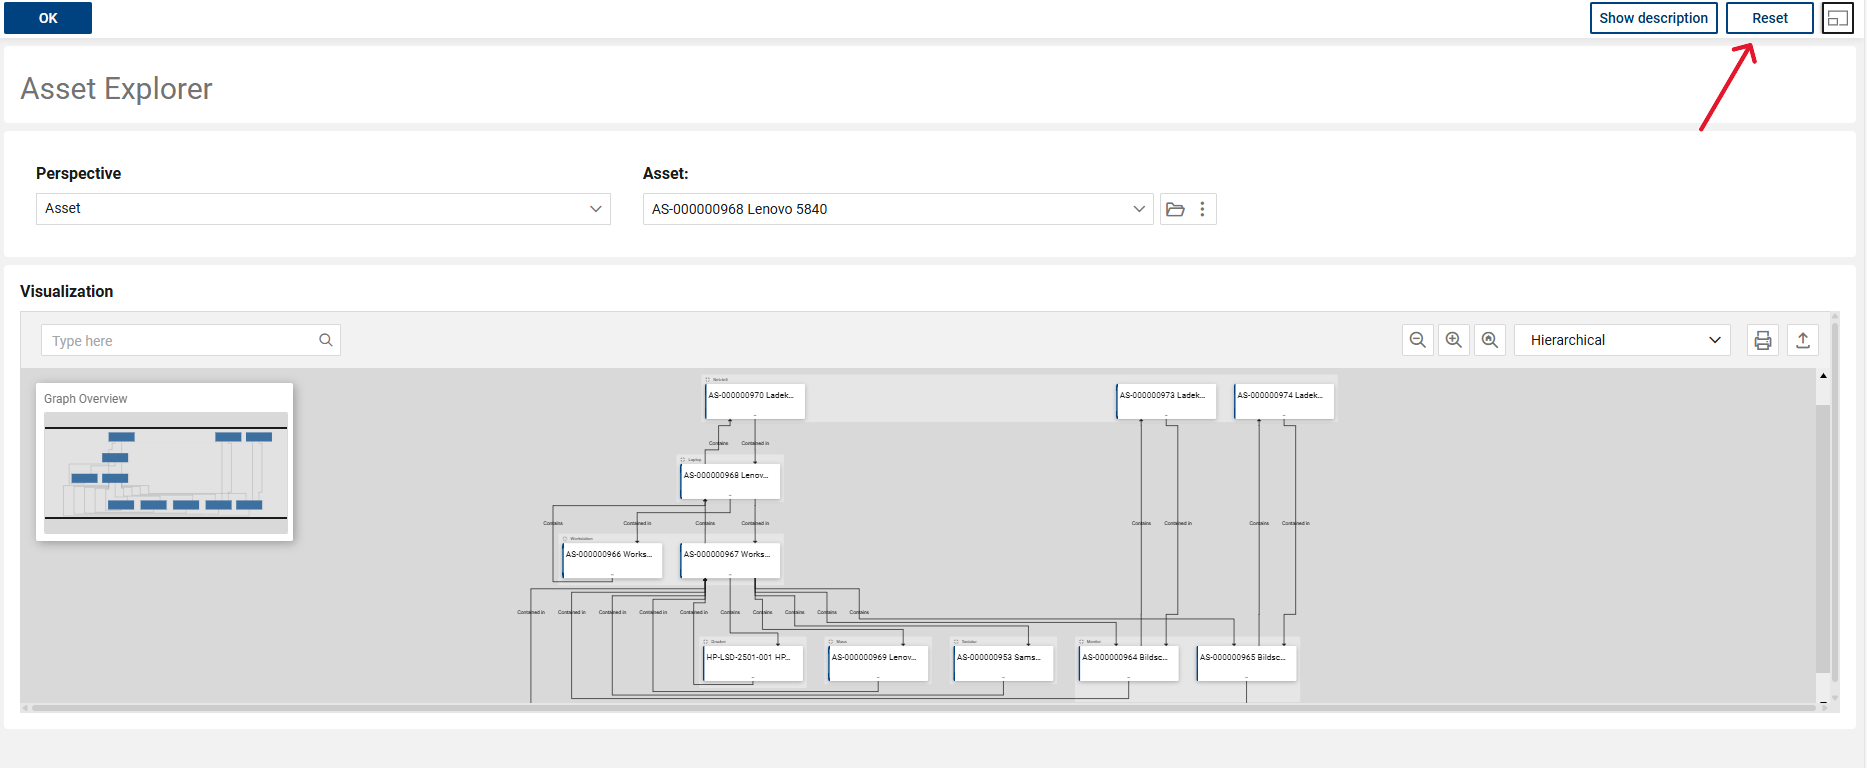
Close the Asset Explorer by clicking the ‘OK’ button at the top of the form. The last perspective selected will remain selected for the next time you open the form.
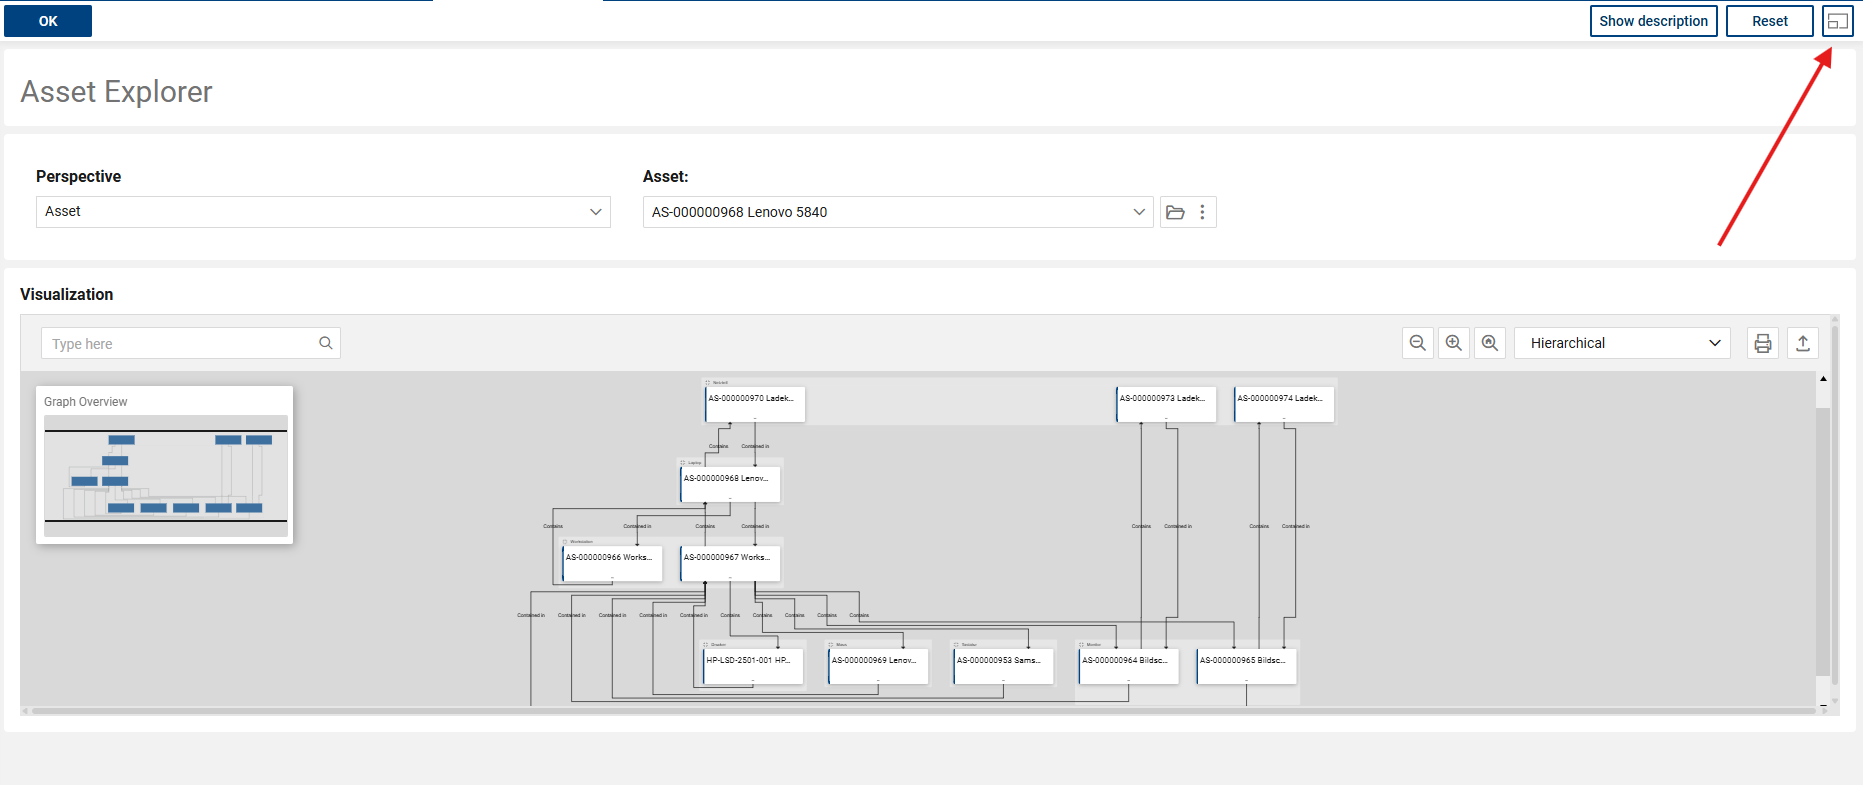
If necessary, you can also switch to full-screen mode using the button at the top right of the image.
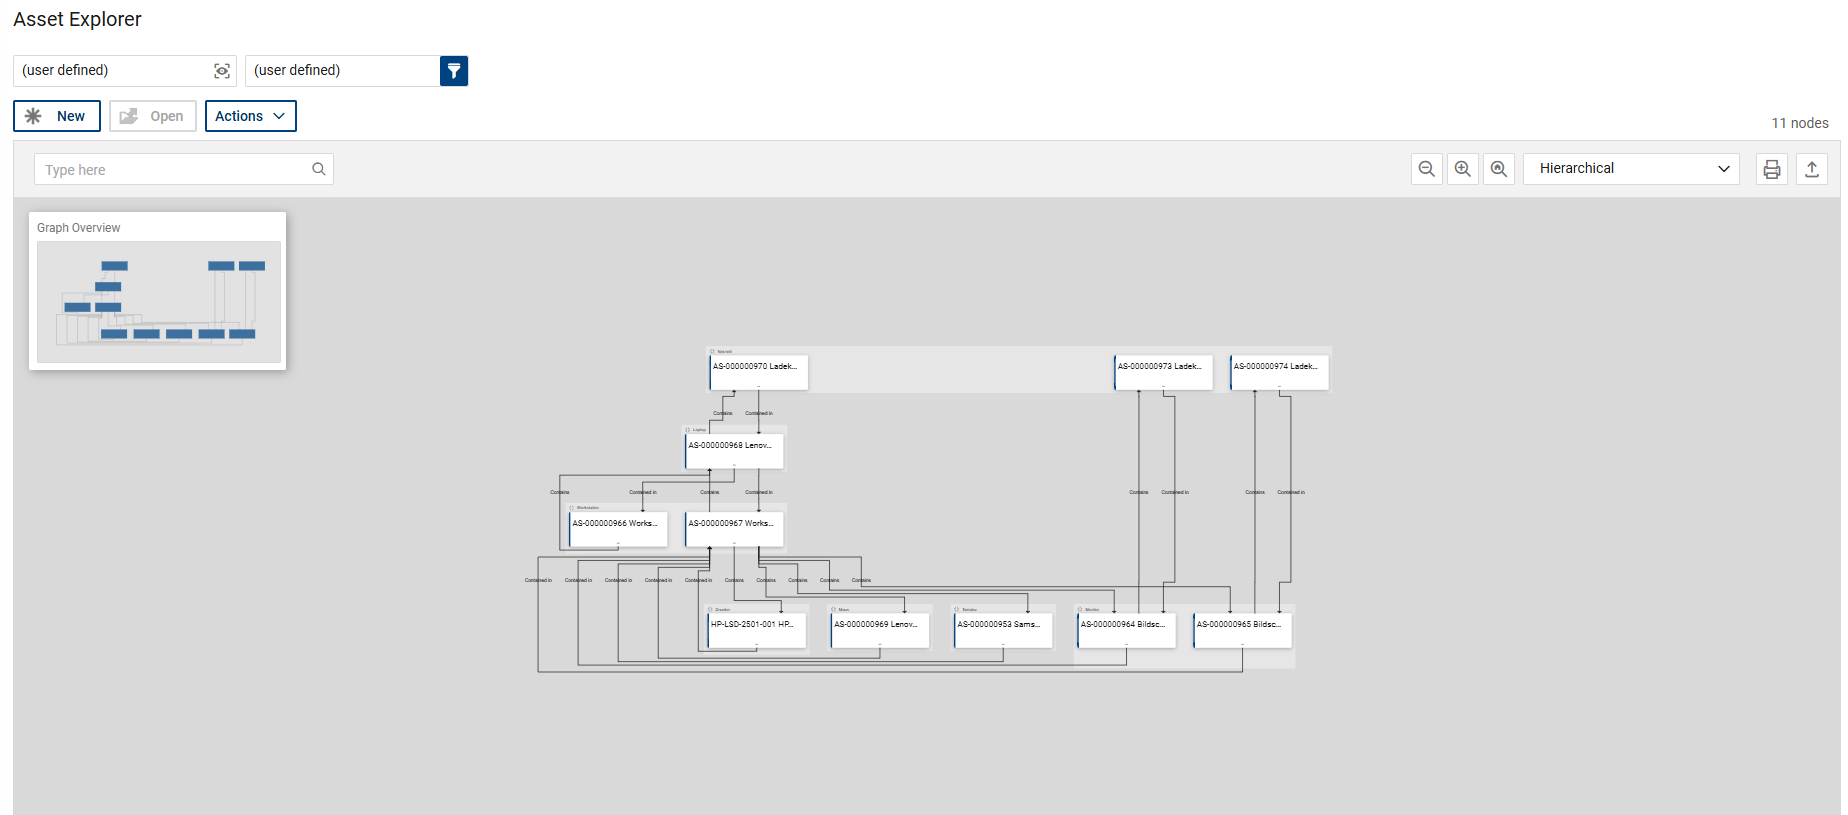
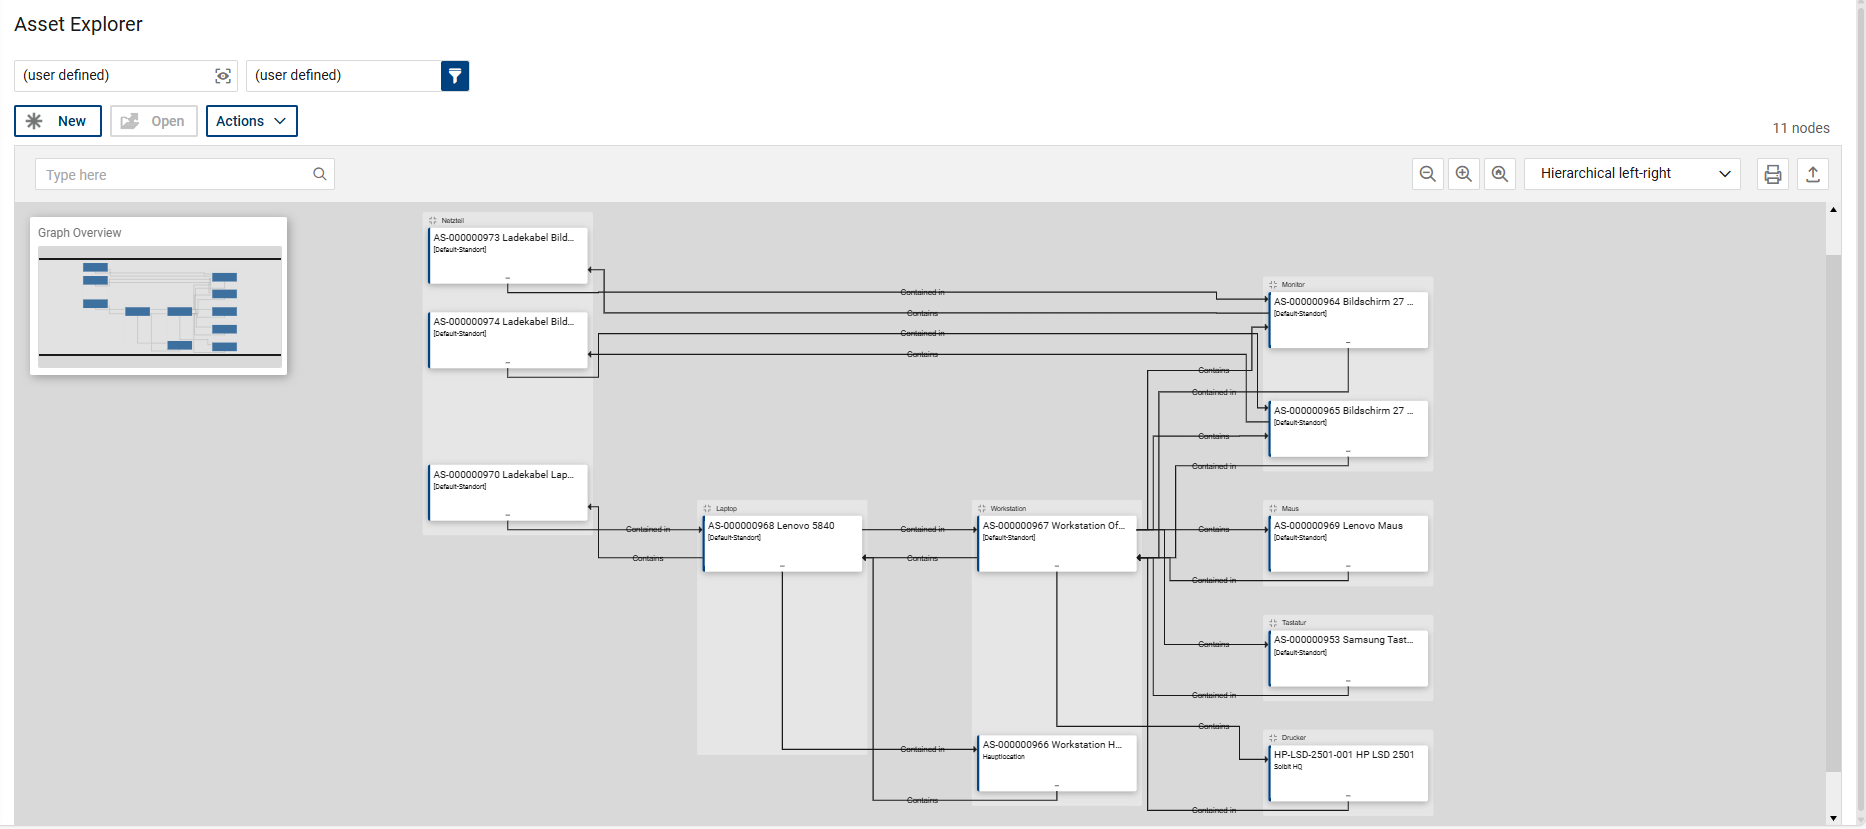
Three different display formats are available for visualisation:
Hierarchical:

Hierarchically left-right:
Organic:
