The Microsoft Power BI Report Template was created to meet the requirements for professional BI evaluations based on the data model.
The selection of included visualizations was defined based on best practices.
The template accesses the "Reporting Interface" function.
The template can be downloaded by clicking on the following hyperlink:
-> Download link PowerBI Template
|
Note: You can use the Power BI report template as provided or adapt it to your own needs, extend it or adopt the basic structure of the queries or visualizations in other Power BI reports that may already be used internally in the company. Furthermore, you can distribute the file within your company for use or optionally provide it to your colleagues via the Microsoft Cloud Service etc. Since we will change our data model, if necessary, as part of a new release version, we cannot guarantee that the original report will always continue to function in exactly the same way. In this case, we will update our template in each case and make it available for download. You may have to make the necessary changes to your customized report yourself. Alternatively, we are happy to offer individual BI report creation and customization as a service. |
|
Note: Currently, the PowerBI report template is only available in German language. If required, the translations can be done individually by customer in the local PowerBI template. |
Setup of Power BI Report
The report can be set up and linked to your system database in just a few steps.
In order to do this, please perform the following steps.
|
Note: The instructions and screenshots presented here are based on the Microsoft Power BI version March 2020. Since Microsoft frequently and irregularly releases new versions for Power BI, the descriptions and illustrations may differ from a newer version. |
1)Install Microsoft Power BI Desktop (e.g. at the official Microsoft site: https://powerbi.microsoft.com/de-de/ ).
2)
3)Open the file with your Power BI Desktop application.
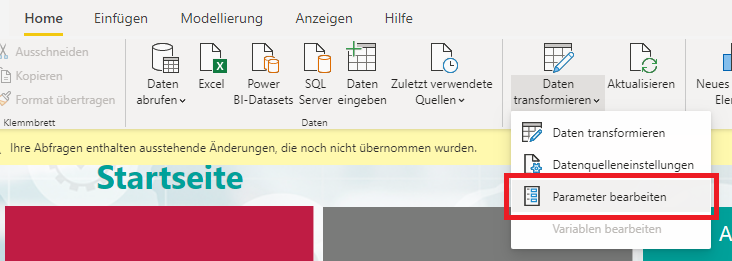
4)In Power BI menu, go to Home => Transform Data => Edit Parameters.
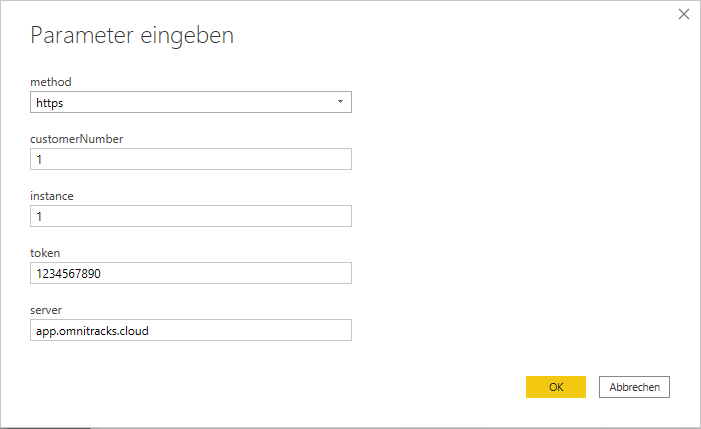
In the parameter dialog, enter all parameters as follows:
•"method": "https"
•"CustomerNumber": your unique system customer number*
•"instance": your unique instance number*
•"token": The security key generated by your system ("token for REST web service")*
•
*As an administrator, you can find this information in "System Administration" under the menu item "Interfaces", under the tile "Reporting Interface" (your customer number; your instance number; Token for REST Webservice).
If no token for the REST interface has been generated here yet, or you want to change the token, use the button "RESET REST TOKEN" for this.
|
Note: Caution: When the token is reset, it must be replaced wherever you access the interface. |

5)Confirm the entry with OK and click on the button "Apply changes".

6)Subsequently, Power BI will try to connect to the ticketing system and load the data from your ticketing system. If this is not successful, please check the entered parameters.
7)Save the report to save the settings you have made.
Details about the visualizations
Below are details of some of the visualizations in the report template.
Home page
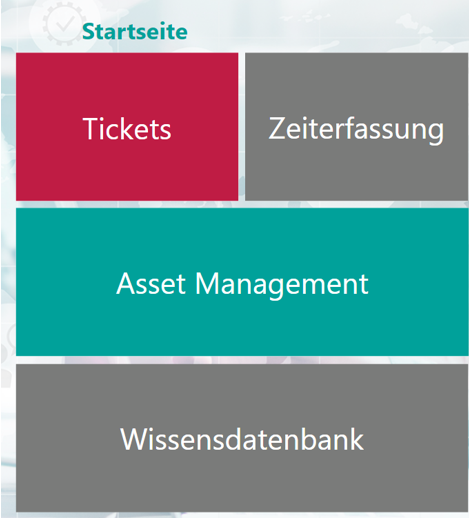
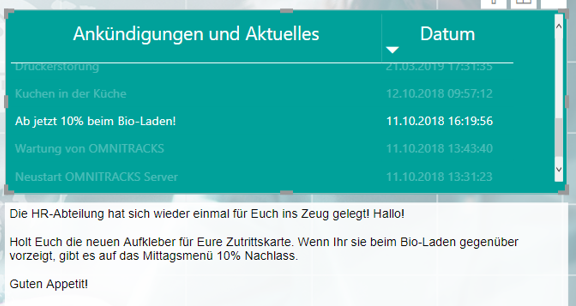
The tiles on the home page on the left are for navigation and can be used in Power BI Desktop with Ctrl + left click. If the report has been published in Power BI (Cloud) or on the Power BI Report Server, a single left click is sufficient. If you select one of the messages in the upper right list on the start page, it will be displayed in a large preview in the lower area.
Ticket Heatmap
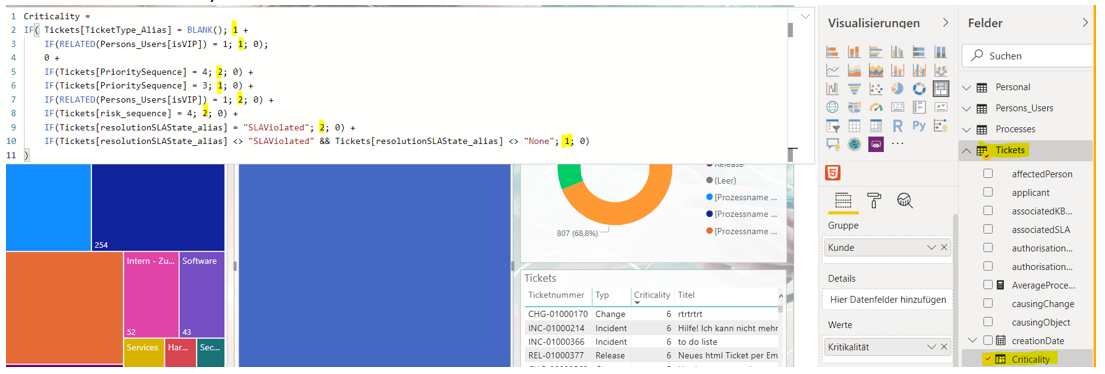
On this page, the calculated metric "criticality" is displayed across different dimensions. For example, the criticality of a ticket is calculated based on whether the person involved is a VIP, the priority and risk of the ticket, or whether the SLA for resolution time has already been violated or escalated. Each of these criteria is assigned a specific score. The total score gives the criticality of the ticket.
The field is calculated using the following "DAX code". The yellow highlighted values contain the weighting of the respective criterion and can be adjusted to your needs, if necessary. Here, a distinction is made between tickets that have not yet been classified (without ticket type) in the upper area of the formula, and tickets that have already been classified.
Tips & Help
Data model
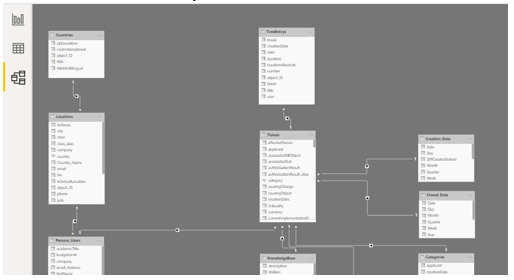
Use the existing data model. In order to create further reports, you can easily extend the existing data model; it is best to copy the report and look at the data model. Some of the relevant tables and, for example, various date dimensions are already included here.
Including a new table
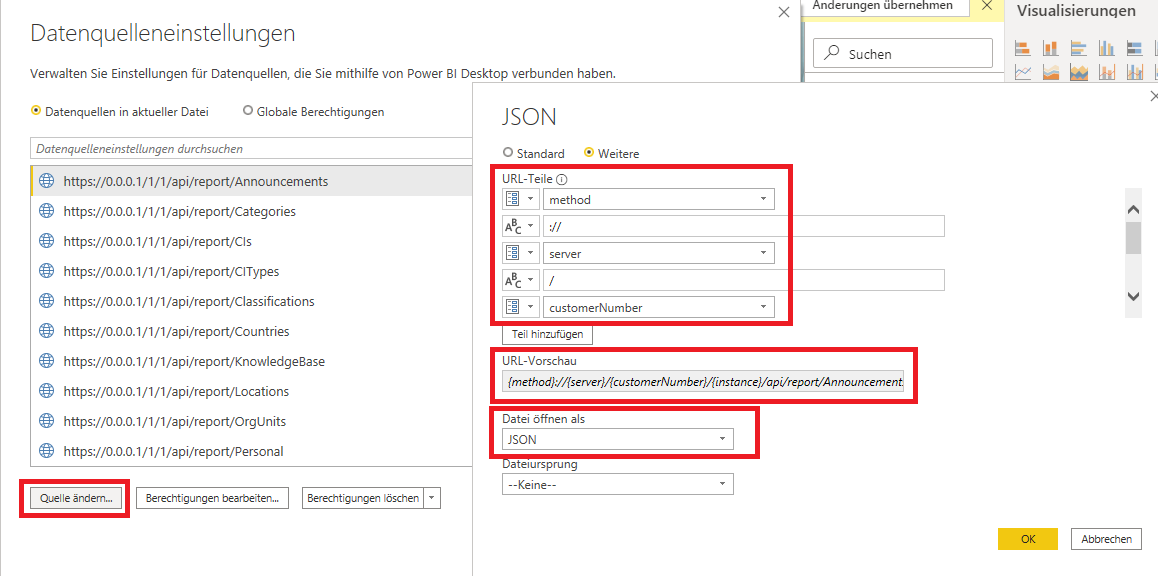
To include a new table in the data model, be sure to use the existing data sources as a template. To do so, open the menu for Home => Transform Data => Data Source Settings and look at the existing queries. Here, it is important how the URL is built.
For a new query, proceed as follows:
1)Click on "Retrieve data"
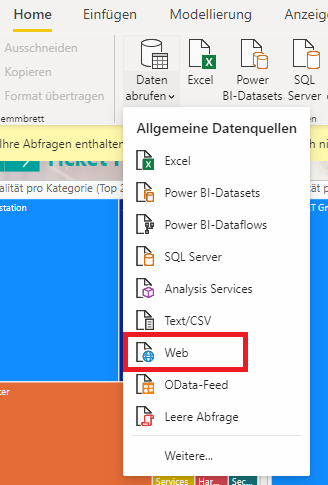
2) Select "Web" as the data source
3)Click on "More" in the new field that appears
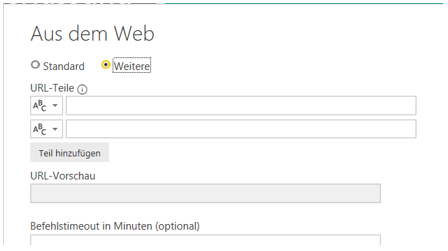
4) Enter all URL parts as described in the example above. Be sure to use one of the existing queries as a template here.
5)In the penultimate parameter, replace the text before the question mark with the name of the table you want to include in the model (see example)
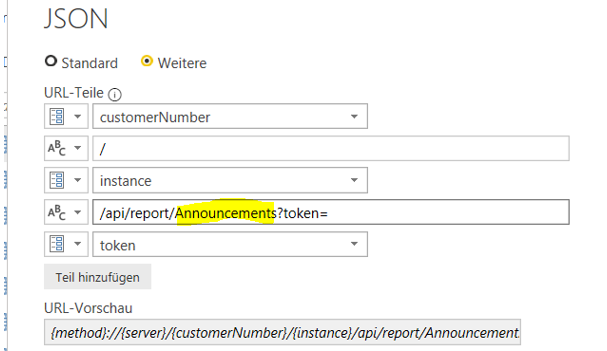
6)You will find the correct name again on the "Reporting Interface" tile in your system administration. There, all URLs per available data table are already pre-generated.

7)If you change the REST token via